Wednesday, 27 May 2020

SQL Server Query Execution Plans for beginners – Clustered Index Operators

In this article we will continue discussing the various execution plan operators related to clustered indexes and what they do, when do they appear and what happens when they do.

When we look at execution plans and start actually doing query optimizations, each of these operators will provide us with some indicator of how SQL Server is running.

These operators need to be understood fundamentally, from the contextual activity, when they are seen, whether they are good or bad, as it pertains to performance implications.

If an operator occurs, we should be able to determine the action plan that we need to take so that these operators do not arise again or if the do arise we understand why.

It is most critical to understanding that these particular recommendations have to be taken with a pinch of salt but can be used without much of harm to SQL Server.

Table Scan

  • When: Table scans occur when a table without a clustered index is accessed. Hence, there is no specific order in which SQL server goes about storing them, this particular heap is to be actually queries like in table scan.
  • Good or bad: For very small tables it does not sometimes make difference. But if it is for a larger number of rows, we will not be happy with the appearance of this operator.
  • Action item: Create a clustered index. Generally, a good practice is that if we have only one index on the table, it is better to be a clustered index.
Now, let us see a table scan operator. We will create the following simple table depending on [SalesOrderDetail] table from [AdventureWorks2014] database using the following script:


Then, we will demonstrate something interesting.

First, let us try to select * from our sample table with including actual execution plan and statistics IO.


Here we can notice that we get the result of 121,317 rows with logical reads of 1,497.

Now, let us try to run the same query using a specific range of values:


The interesting thing, alluded to previously, is that when we don't have a clustered index we will end up with table scan which means we will have the same logic reads no matter how big the result we are selecting is. So, it will be much better if we have created a clustered index. This will be further demonstrated in next section.

Clustered index scan

  • When: Table with a clustered index is accessed
    • The table does not have non-clustered index
    • The query cannot use the non-clustered index
  • Good or bad: If we have to make a decision whether it is good or bad, it could be bad. Unless a large number of rows, with many columns and rows, are retrieved from that particular table, a Clustered index scan can degrade the performance.
  • Action Item: Evaluate clustered index keys.

Clustered index seek

  • When: A table with clustered index is being accessed and the B tree structure is able to narrow down, based on our clustered index, to get a limited set of rows from the table.
  • Good or bad: This is the ideal condition. It is generally good to see the Clustered Index Seek
  • Action item: Evaluate the possibility of using a non clustered index, so that we gain the possibility of eliminating, if required, even the Clustered Index Seek.
For the previously created table 'MySalesOrderDetail', we are going to create a clustered index primary key on [SalesOrderID] and [SalesOrderDetailID].


We can see that the query completes with 12,317 rows, which is same as what we used to get before.

The message tab, ironically, is giving 1,502 logical reads. Now, this is a little bit more when compared to what we used to get with 1,497. The 5 additional pages that we are actually getting are based on the B tree that had to be formed because the intermediate notes and first IAM had to be built and that is exactly what 1,502 is.

If we get to the execution plan here, we can see that unlike the previous time of Table Scan, you are getting Clustered Index Scan. This is a slight improvement that we have seen.

Now, let me get to the specific case where we went about doing value collection. In this particular case same as what we selected before


Here we get a single row and if we get to the message tab we can see it shows three logical reads.

If we move to the execution plan, we can see the Clustered Index Scan which was in the previous case has been transformed into a Clustered Index Seek. hence SQL server was able to narrow down, using the clustered index key. to obtain this particular value based on the where condition, which is in the seek predicate.

Summary

Execution plans are a very important tool for optimizing query performance. Every DBA needs to know all operators that appear in the execution plan and decide whether it is good or bad and what to do if it is the latter.

SQL Server Query Execution Plans for beginners – Types and Options

When a DBA is working with the SQL Server, he/she might sometimes say that the execution plan is like a black hole. A matter of fact, though, we have to look at execution plans as weather forecasts.

In this article, we will be discussing various aspects of execution plans, types and common options.

Query optimization

The fundamentals of query optimization are based on the fact that SQL Server has always been a cost-based optimizer.

The CPU, IO and memory are some of the parameters SQL Server uses in recognizing the cost and finally generating the execution plan.

What we will write against SQL Server is often totally different from what SQL Server actually executes. Hence, that is in the concept of logical query operations when compared to the physical operation with SQL Server uses.

For example, when we are talking about a logical INNER JOIN which actually gets translated physically on the execution by SQL Server as a nested loop JOIN.

Let us execute the following query to view the concept of logical query operation. We can check the option of include actual execution plan or CTRL + M

Here you can see that the physical operation involves nested loops while the logical operations here is the inner join which is defined inside our select statement.

Finding an optimal plan

The way SQL Server ultimately determines an optimal plan is by finding the balance between what plan it wants to select and the maximizing the effectiveness of that the particular plan before the actual execution happens.

So there is a give and take between generating the best plan and completing the task, in a finite amount of time, before SQL Server has to step out from indefinitely going about optimizing the query plan

SQL Server does this cost optimization and it is quite efficient in actually bringing about the best plan as fast as possible.
Let us check whether SQL Server chooses the optimal execution plan for the previous query or not. What we are going to do is to go ahead and explicitly state a hash join and compare execution plans.

This shows that giving an explicit hint in this particular case seems to be costly.

With applying the 80-20 rule, it is advisable to leave SQL Server (cost-based optimizer) to choose which is the best and most optimal plan is.

Estimated Execution Plans

The estimated execution plan, for all practical purposes, uses statistics and many other parameters based on what is available on this server and generates the plan.

This is an estimated plan and not specially the plan that has been generated by SQL Server.

This is synonymous to the first analogy that we had given about the weather forecast.

Next we'll review various display options for estimated execution plans.

SHOWPLAN_TEXT

This option is similar to the estimated graphical execution plan, as it gives us the text of the execution plan and gives us information about what the execution plan is. It does not give any of the frills which are normally associated with the execution plan.

SHOWPLAN_ALL

This option is similar to the estimated graphic execution plan, but has some of the additional features attached to it including the type of physical operator and type of logic operator.

This again is the estimated execution plan; remember we did not see a result set where the actual query has been executed.

SHOWPLAN_XML


We can see that the query plan comes in a XML format. We can look at execution plan as per estimation.

Actual Execution Plan

We said that the estimated execution plan is like the weather forecast, so the actual execution plan is where you can realize whether it actually rained or not.

It shows what SQL Server actually does to get the result of your query.

Here we'll review the display options for actual execution plans,

STATISTICS TIME

This option gives you the amount of time that has been spent as far as SQL Server is executing this particular query. It also provides us interesting insights into some of the information.


In this particular case, the query gets executed with 163 rows and we can also see how much time of CPU that this particular query has taken and what is the actual time with respect to the execution process.


So here it states that the execution time is close to about 196 milliseconds.

If we want to know granular to what exactly the query is executing and how much of time and resources it is taking, this is one of the most ancient ways but still effective to use on any day.

STATISTICS IO

This option shows the IO characteristics. We can see that this particular query in this particular table has gone ahead and done these mini scans and these are the logical reads.


If we have scans and other mechanism hardware we will also see something which is interesting. We might also see physical reads, read-ahead reads and large object data including the reads that are associated with it. 

When we have a large number of reads of a complex query, we might use these methods to actually look at which table is sending out a large number of reads and hence it is getting near the physical IO subsystem.

A physical read in this particular case shows zero because it is not getting cached. And if this value is very high means lot of physical IO has been happening to bring the data from IO subsystem or our hard disk to the memory or the buffer pool.

The set statistics time on and set statistics IO on are great set operations that we can actually use to see how SQL Server goes about executing.

We can also use profiler as a mechanism to actually go ahead and look at these values. But when we are analyzing a simple query or optimizing a simple operation, it is always handy to have these simple tools which work even from SQL 2000 days and these are very handy tools that give you information and insights into the query that we are playing with.

STATISTICS PROFILE

This is like SHOWPLAN_TEXT for estimated Execution plans but it retrieves the text of the actual execution plan which means that the query has already been executed.


STATISTICS XML

Also like SHOWPLAN_XML this option shows the actual execution plan in XML format.


Summary

Execution plans are a very important indicator for optimizing query performance. Every DBA needs to know all the details about the execution plan. 

Thursday, 21 May 2020

Getting started with SQL Server Query Tuning

This article will cover some essential techniques for SQL query tuning. Query tuning is a very wide  topic to talk about, but some essential techniques never change in order to tune queries in SQL Server. Particularly, it is a difficult issue for those who are a newbie to SQL query tuning or who are thinking about starting it. So this article will be a good starting point for them. Also, other readers can refresh their knowledge with this article. In the next part of this article we will mention these techniques that help to tune queries.

Avoid using the asterisk "*" sign in SELECT statement


We should use the asterisk (star) sign solely when we need to return all columns of the table. However, this usage type becomes a bad habit by the programmers, and they start to type their queries with the "Select *" statement. At various times, I have experienced that the "Select *" statement is used to retrieve one column of the multi column tables and worse than that developer is not aware of this problem. This usage approach causes more network and IO activity, so it affects the query performance negatively because of the more resource consumption. Now we will make a pretty simple test to find out the performance difference between "Select *" statement against "Select column_name1, column_name2, column_nameN" statement. Assume that, on a web application, we only need to show two columns, but we used asterisk sign in our query.

SSMS offers a very helpful tool that help to analyze and compare the executed queries performance metrics. This tool name is Client Statistics, and we will activate this option before executing the following two queries.

As we can see obviously, there is a dramatic difference between the received network measurements of these two select statements in the Network Statistics section. At the same time, the Time Statistics measurement comparison result does not change for the "Select *" statement. It shows poor performance than the "Select column_name1, column_name2, column_nameN" statement. In light of this information we can come to this outcome "As possible as we should not use the asterisk signs in the SELECT statements".

Don't use scalar-valued functions in the WHERE clause


A scalar-valued function takes some parameters and returns a single value after a certain calculation. The main reason for why scalar-valued functions affect performance negatively, the indexes cannot be used on this usage approach. When we analyze the following query execution plan, we will see an index scan operator because of the SUBSTRING function usage in the WHERE clause.
The index scan operator reads all index pages in order to find the proper records. However, this operator consumes more I/O and takes more time. As possible, we should avoid the index scan operator when we see it in our execution plans.

On the other hand, particularly for this query, we can improve their performance with a little touch. Now we will change this query as below so the query optimizer will decide to use another operator.
The index seek operator only reads the qualified rows because this operator effectively uses the indexes to retrieve the selective rows. At the same time, it shows great performance when against the index scan operator.

Tip: Scalar-valued functions are executed for each row of the result set, so we should consider the rows number of the result set when we use them. They can damage the query performance when trying to use for the queries which will return a huge number of rows. However, Microsoft has broken this traditional chain with SQL Server 2019 and made some performance improvements in the query optimizer for the scalar-valued functions and it has been generating more accurate execution plans if any query contains the scalar-valued function.

Use the covering indexes to improve the query performance


Covering indexes contains all referenced columns of the query, so they improve the selectivity of the index, and if any query uses this index it accesses the data more efficiently. However, before creating any covered index, we need to figure out cost-benefit analyses because any new index directly affects the performance of the insert statement. Now we will analyze the execution plan of the following query.
As we learned, the index scan operations is not shown good performance during the execution of the query. To overcome this problem, we will create the following index. The main characteristics of this index is that it covers all the columns of the query through the index key or included columns.
The execution plan of the query has started to use an index seek operator, and this operator shows better performance than the index scan operator.

Use the UNION ALL operator instead of the UNION operator

UNION ALL and UNION operators are used to combine two or more than two result sets of the select statements. However, the main difference between these two operators is the UNION operator eliminates the duplicate rows from the result set. In terms of the query tuning, UNION ALL operator perform better performance than UNION operator. As a result, if we don't consider the duplicate rows in the result set, we should use UNION ALL operator in our select statements. When we compare execution plans of the following queries, we will see a noticeable difference between these two execution plans. At first, we will compare the execution plans.
When we analyze the comparison of the execution plans, we can see that the Sort Operator adds extra cost to the select statement, which is using the UNION operator. As a final word about these two operators, if we don't consider the duplicate records, we should use UNION ALL operator to combine the result sets.

Use Actual Execution Plans instead of Estimated Execution Plans

The execution plan offers us to the visual presentation of the query processing steps. When we analyze any execution plan, we can clearly understand the road map of the query, and it is also a significant beginning point to tune a query. The estimated and actual execution plans are the two types of execution plans that can be used by us to analyze the queries. During the creation of the estimated execution plan, the query does not execute but generated by the query optimizer. Despite that, it does not contain any runtime metrics and warnings.

On the other hand, the actual execution plan contains more reliable information and measurements about the query. Actual Execution plans provide an advantage to tune the query performance.

Another approach can be combo usage for the execution plans for the queries which have longer execution times. At first, we can check the estimated execution plan and then re-analyze the actual execution plan.

Tip: If a query includes any temp table, the estimated execution plan cannot be generated. It will be given an error when we try to generate it. The following query will return an error when trying to generate an estimated execution plan.

Conclusion

In this article, we learned essential techniques to tune SQL queries. Performance tuning is a very complicated and struggling task to accomplish, but we can learn this concept from easy to difficult, and this article can be a good beginning point to start. 

Wednesday, 20 May 2020

Single package deployment in SQL Server Integration Services 2016

SQL Server 2016 has some exciting enhancements to SQL Server  Integration Services. In this article, we take a look at how the issue of single package deployment into an SSIS Catalog has been resolved with SQL Server release.

Prerequisites

The demonstrations in this article were conducting using SQL Server 2106 RC3 and Visual Studio Community 2015.

Background

In my personal experience, delivering SQL Server Business Intelligence solutions using SQL Server Data Tools (SSDT) is by far a more favorable experience compared to its predecessor, Business Intelligence Development Studio (BIDS). Some of many advantage that makes SSDT better than BIDS ranges from features like multiple deployment models to choose from, built in package catalog logging mechanisms to trivial things such as the ability to undo or re-do changes in you SSIS packages.

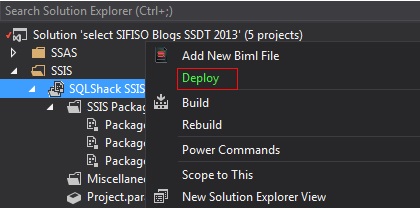
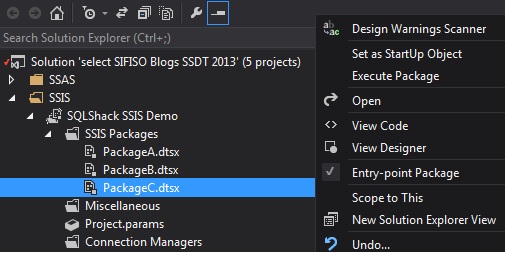
Most of the aforementioned features relating to SSIS packages such as catalog logging are only available in the project deployment. Unfortunately, one of the key limitations in project deployment model is its inability to deploy single packages. For instance, if you had to refactor Package 73 in a solution with 100 packages, you will have to re-deploy the entire solution with all 100 packages even though you only made changes to a single packages. Figures 1 and 2 illustrates the lack of single package limitation where by the Deploy option is available at the project level of an SSDT 2013 solution but disappears when attempting to deploy individual package PackageC.
Figure 1: Project deployment in SSDT 2013
Figure 2: Attempting to deploy single package in SSDT 2013
The only workaround to this limitation was to firstly convert existing project deployment mode to package deployment model and then deploy the converted solution. However, this workaround has always been ineffective as package deployment models are not setup to make the deployments into SSIS Catalog which meant that every time you converted from project to package deployment model you had to forego the features inherently available in the SSIS Catalog.

How to Deploy Single Package into SSIS Catalog

  • Visual Studio

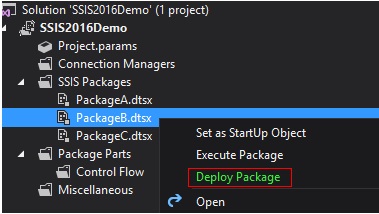
    With the release of SQL Server 2016 and SSDT 2016 the issue of single package deployment is now a thing of past. For instance, Figure 3 shows an SSIS 2016 project with the New Deploy Package option that comes up for deploying individual packages within a project deployment model. This means you no longer have to convert to package deployment before you can deploy individual packages!
Figure 3: Project Deployment Model in SSDT 2016
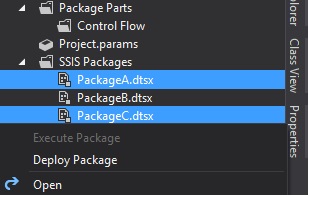
With this new feature, you are not just limited to deploying single packages instead you can also deploy multiple packages. As shown in Figure 4, all you need to do, is to click and hold down the control key (Ctrl) and then choose the packages that you want to display.
Figure 4: Multiple Package Deployment in SSDT 2016
So far we have seen how we can deploy a single package as well as multiple packages within the project  deployment model. So what happens if, like Figure 3 we chose to deploy PackageB but after been redirected to the Deployment Wizard screen we realized that actually we needed to deploy PackageA too? Well in this version of SSDT 2015/SSIS 2016, we are able to correct our selection prior to deploying to the SSIS Catalog.

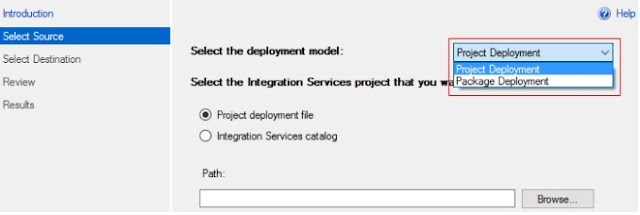
All we need to do is go back to the Select Source Step and check(uncheck) the package that we want to add/remove in our deployment step as shown in Figure 5.
(Note: The Integration Services Deployment Wizard often jumps from the Introduction step to the Select Destination Step. So, if we  want to get to the Select Source Step we will have to click the Previous button)

Figure 5: Integration Services Deployment Wizard

  • ISDeploymentWizard

    Generally, many features in Visual Studio are rendered as standalone executable programs. Not surprisingly, whenever we click Deploy or  Deploy Package in SSDT 2015, Visual Studio launches a separate application, ISDeploymentWizard as shown in Figure 6.
Figure 6: Location of IsDeploymentWizard file
 Therefore, another way of deploying packages is to launch the ISDeploymentWizard application directly. There are advantages and disadvantages of deploying packages directly from wizard. One advantage is that because Visual Studio can sometimes consume more of  our system resources such as memory and CPU, as shown in Figure 7, deploying packages directly from the wizard is likely to save from a possible system performance bottleneck experience.
Figure 7: Task Manager
Prior to launching the deployment wizard Visual Studio collects all information that will be part of the deployment and passes it along to the wizard. That is why the Select Source step is often skipped as it is already preloaded with source information collected by Visual Studio. Unfortunately, when launching wizard directly, we get a blank screen as shown in Figure 8 and we will have to specify everything from the beginning.
Figure 8
  • Command Line Deployment

Command line deployments are usually necessary when SSIS build and deployment is automated or managed as part of Continuous Integration process. Command line package deployment to catalog is again made possible via the ISDeploymentWizard execution file.

The hardest part in this type of deployment is getting the command line syntax correct. The easiest way to get the command syntax is by copying it out of the wizard's summary page as shown in Figure 9.
Figure 9: Deployment summary screen
The next step would be then to launch windows command line program and change its working directly to the SQL Server path that contains ISDeploymentWizard exe file. Finally, we just need to past the command line copied above and press enter to deploy as shown in Figure 10.
Figure 10: Command line package deployment
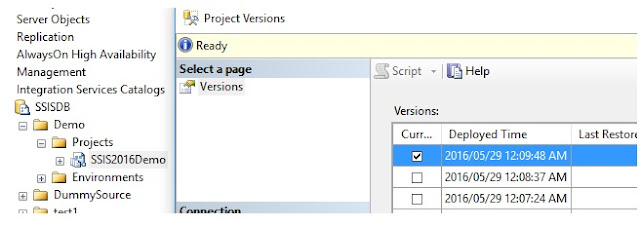
Soon after a new line with path to working directory will come up which will mean that our deployment was successful. Another way to confirm that the deployment was successful is by looking at version number of our project - the current version should have deployed time closer to the time you deployed via command line.

Figure 11: Catalog project versions

Conclusion

With all its advantages, SSDT had previously failed to address the issue surround single or manual package deployment into the SSIS Catalog. However, the recent release of SSDT 2015 for developing BI solutions into SQL Server 2016 introduces various ways of deploying single packages without converting to package deployment model.

Tuesday, 19 May 2020

Deploying Packages to SQL Server Integration Services Catalog (SSISDB)

Starting with SQL Server 2012, Integration Services (SSIS) packages can now be deployed to a single source for managing execution in multiple environments. The SSIS Catalog is a single database container for all deployed packages. The configuration files are replaced with Environments. Deployed versions are tracked historically and a package can be reverted to a previous deployment. On top of these features, internal reports with a dashboard help when debugging errors or examining performance over time.

To use this feature, the SSIS Catalog must be created. The System Administrator of the SQL Server instance needs to create the Catalog or a user with elevated permissions for creating databases. Figure 1 shows the menu after right clicking on the Integration Services Catalog folder in SSMS
Figure 1 Integration Service Catalog
The Create Catalog... menu option will launch the Create Catalog window. Some configuration takes place during the creation. CLR integration will need to be enabled on this instance. On SQL Server Startup, the automatic execution of SSIS stored procedure(s) can be enabled or not. The most important part is to provide a strong password for the management of this new database container,
Figure 2: Create Catalog Window
When the configuration is complete a new database is created on this instance: SSISDB. The database needs the same maintenance as any other production database on this system. Maintenance items include backups, index rebuild/reorganize and update statistics. The recovery model of the database inherits the properties from the Model database just like all new databases. Simple recovery mode is adequate for SSISB because of the infrequent deployments.
Figure 3: SSIS Catalog Projects Deployed
A user does not need to be a SysAdmin to deploy projects (and packages) to the Catalog. There is a Database Role named ssis_admin in the SSIS database. This role contains the permissions to deploy projects from Visual Studio. A developer's Active Directory (AD) account or an AD group can be added to this role.
Figure 4: ssis_admin Database Role in SSISDB
Deploying SSIS projects along with the project's package(s), was added in SQL Server 2012 as well as the SSIS Catalog. This organization of packages in SSIS Project enables objects, properties and values to be shared among the packages in a project. Figure 5 shows the project.param file associated with a SSIS Project.
Figure 5: Project Parameters
This project has multiple packages. The Source Database and Source Server is shared with packages like DimProduct and DimCategory. The connection is created under the Connection Manager in the Project's solution as seen in Figure 6. Not only can the package can share parameter values, it also shares these database connections. This example contains staging, source and destination databases. The prefix (project) is added to the Package Connection Managers connections as seen in Figure 6 under the objects of the package.
Figure 6: Project Connection Managers
In this environment the development team uses a separate server as the testing team and production system. The use of Project Parameter enables a single change to effect multiple packages in the project. To deploy the project to the SSIS catalog, right-click the project in the solution explorer of Visual Studio.
Figure 7: Deploy Projects and Packages
The Integration Services Deployment Wizard will show a welcome screen. Yon can disable this screen for future deployments. The Select Source will default to the project selected while in Visual Studio. The wizard first brings you to the Select Destination page, but you can use the back button to go to the Selected Source page. The Source Selection can be changed, but usually the deployment wizard is launched from the project being deployed. Figure 8 shows the Select Destination screen where the Server Name and Path in the SSIS Catalog are selected.
Figure 8: Select Destination Screen of SSIS Deployment Wizard
The Server name will be the instance the Catalog was created. The Path can be an existing one or a New Path can be created. The same path can be used for different projects. All project packages will be together under the project in the Path.

The Review screen gives the options to view the selected source and destination. Once the Deploy button is selected on the Review screen, the Results screen will show the success list or an indication of what failed during deployment.
Figure 9: Result screen of SSIS Deployment Wizard
A package can be launched in several ways. In SSMS, the Integration Services Catalog folder can be expanded to see the paths created in the Catalog. Figure 10 shows the menu from right clicking the package DimCategory in the SSIS Catalog.
Figure 10: Executing a Package from SSIS Catalog
After selecting Execute... from the menu, the execution prompts for Parameters, Connection Managers and Advanced Options. Figure 11 show the Parameters that can be changed before the DimCategory package is executed. This is where we can change the server or database names for the Project Parameters before the package is executed.
Figure 11: Executing a Package from SSIS Catalog
One of the cool features of the SSIS Catalog are free ports. Figure 12 shows the execution report that can be displayed after launching the package. There is a prompt to view or not view the report. There are two additional links to drill down into Messages and Performance. Individual Tasks can be drilled into to show messages from different steps of the package.
Figure 12: Report Overview of Package Execution
If there is an error, the messages are the best place to start to debug a package. To see the performance of this package over time, click the View Performance drill down report.

There is a main Dashboard that can be used to see an overview of all packages running from the Catalog. This dashboard is launched from SSMS by right clicking on the SSISDB folder under the Integration Services Catalog. Figure 13 shows the path to the report.
Figure 13: Launching the Integration Services Dashboard
Figure 14 shows for today one package has executed successfully and another has failed.
Figure 14: Integration Services Dashboard
By clicking on the Failed number, the next report gives the ability to drill into the Messages returned from the success and fail steps of the package like in Figure 15.
Figure 15: Failed Package Messages report
As you can see, the SSIS Catalog has a wealth of information and management for SSIS projects and packages. The reports and drill down capabilities help with debugging problems before opening the package in Visual Studio. Performance reports can give an idea if a package is taking longer to run in the last execution than previous executions. History can be configured and is explained more in the side note at the end of this article. The Catalog is a great place to store and manage SSIS package deployment and execution

SQL Server Query Execution Plans for beginners – Clustered Index Operators

In this article we will continue discussing the various execution plan operators related to clustered indexes and what they do, when do the...